At Agile Collective, we are committed to embedding digital inclusion in everything we do. From accessible web design to usability testing with diverse audiences, digital inclusion is at the heart of what we do.
What is the Benchmarks reporting tool?
To step up our digital inclusion efforts, we set the goal of bringing our sites into compliance with a number of benchmarks. The Benchmarks Working Group, the group of people championing this initiative, met regularly to decide what the benchmarks would be, how we would measure them, and at what point they would be reviewed.
For the first phase of the project, it was decided that a Command Line Interface (CLI) tool would be developed. The CLI tool would run tests on all the sites and check:
- If a site’s HTML is valid
- If it’s hosted on Green hosting
- If there are errors in the browser console
- If it has Critical or Important errors in Axe accessibility testing
- Its performance, based on the Core Web Vitals
- If it’s compatible with minimum browsers and
- If it’s compliant with WCAG 2.1 AA Level
The idea was that testing our sites against these criteria would allow us to monitor how our digital initiatives are performing, and help us understand what works and what needs improvement. In this context, the reporting tool would help effectively visualise the test results from all the sites and present them in a readable and usable format.
What was the process?
With the testing processes already in place, we had to design and build the interface that would allow us to display and interact with the test results.
The first thing we did was to organise a Theory of Change workshop, where we identified the aims and desired outcomes of this reporting tool. We agreed that we needed a tool that would help us:
- See the test results for a specific site
- View previous results for a site
- Have an overview of how all of our sites are performing
- Access results from manual testing (minimum browsers and accessibility testing)
After identifying and agreeing on the project's scope, a design Sprint was held, where we analysed users’ needs and looked for inspiration from similar reporting or dashboard tools.
Throughout this process, we were also exploring if this would be a suitable project for the end of my apprenticeship. The final phase of my Software Developer Level 4 apprenticeship had to be a project “designed to ensure that the apprentice’s work meets the needs of the business” and would allow me to demonstrate the necessary skills to pass the final assessment. With a clear scope and a key business need identified, we decided that this project would be perfect as my final apprenticeship project.
Having most of the assets needed and with my admittedly not-so-great Figma skills, I jumped right in and tried to create some wireframes.
The wireframes went through several iterations, as I asked for feedback from everyone involved. By the time I gathered feedback from everyone and incorporated it into the wireframes, our designer, Steph, joined the project team and gave life to the User Interface by transforming the wireframes into proper UI mock-ups.
At that point, I had the assets needed to start focusing on the software design and architecture of the tool.
What was the tech stack?
To find a suitable tech stack for this project, I started researching different technologies, keeping in mind that we need a solution that:
- Requires minimal infrastructure
- Can be self-hosted
- Supports an authentication system
- Exposes APIs
- Is straightforward to learn, set up, and maintain
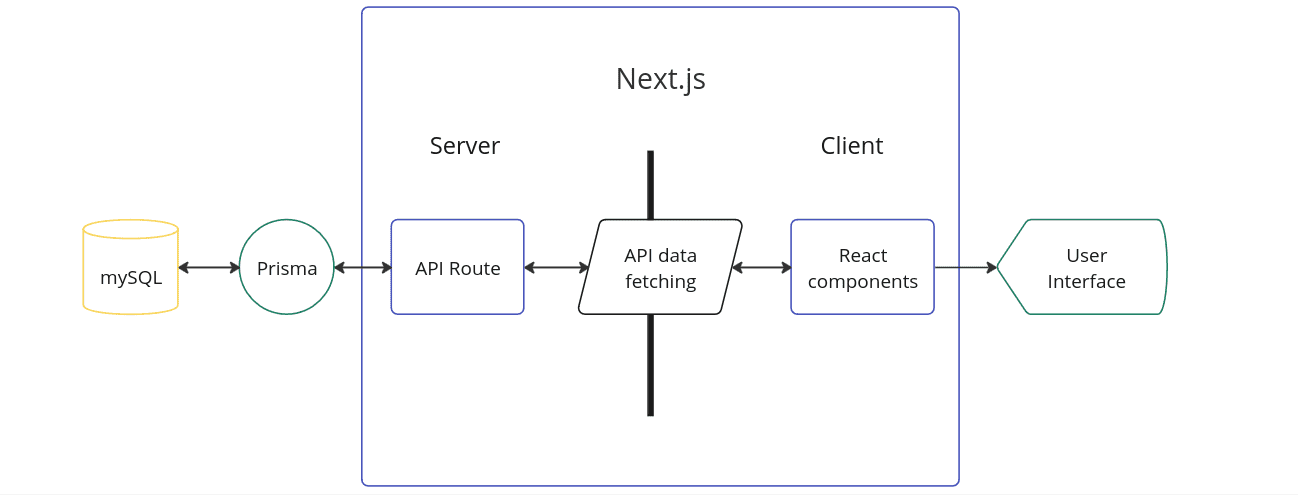
With the above in mind, I chose Next.js mainly because:
- It allows us to build the frontend and backend of the application using the same programming language, JavaScript.
- A Next.js app can be deployed to a node server without the need to use a third party for deployments.
- It is a seamless process to add authentication using the NextAuth.js library.
- It is an active, well-documented, and well-supported project.
- Having already used it in the past, I was familiar with Next.js and was quite satisfied with the Developer Experience.
For the database, I used MySQL, and the relational database schema was already in place before I started the development process.
As a connector between the database and the backend, instead of using a node.js driver, I used Prisma, an Object Relational Mapping (ORM) that would act as a bridge between the application and the database and would handle all the operations from connecting and disconnecting to the database, querying data, generating and applying migrations, in an easy and straightforward way.
Finally, I used TypeScript as the programming language because it would allow us to define custom data structures using interfaces and types, which would make it easier to understand the shape of the data and to maintain it in the future.
The Developer Experience was smooth and intuitive. I was pleased with my choice of working with Prisma. The learning curve was steep in the beginning, especially for more complex operations, but after the first week, I started getting used to writing queries and confidently running migrations when needed. The autocompletion feature helped me understand what Prisma expects and thus write queries faster. Based on my first experience using Prisma and TypeScript with Next.js, I would definitely choose to work again with this Tech Stack in the future to build modern full-stack applications.
What were the outcomes?
After 7 weeks of development, the Benchmarks tool was successfully built. Using the data gathered from running tests on the CLI, we gained a detailed overview of which tests a site is failing or passing, along with the corresponding scores and pages.
With these metrics in place, we can take actionable steps to improve the performance and accessibility of our supported sites and make sure that all the new sites we develop are compliant with our benchmarks.